Morris.js is a lightweight and relatively simple JavaScript charting solution compared when compared with some of the others in the sector which have lot of options.
However with that simplicity comes a lack of documentation.
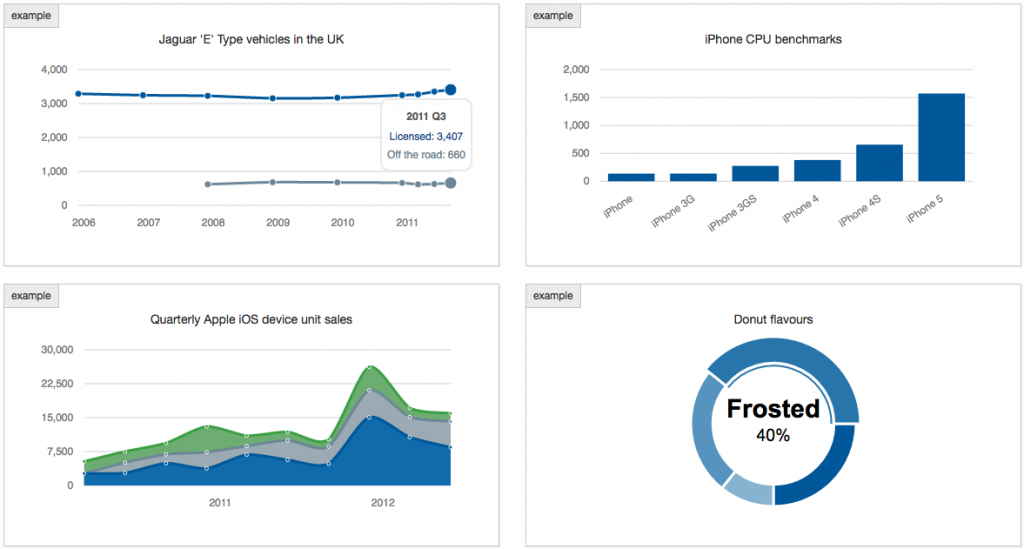
Adding a custom hover event to donut chart
Here’s some HTML which adds a visible label element (like you get with a line chart) next to the donut chart:
2010 Q4 this is a test
I won’t cover how to create the donut chart in JavaScript as you can just lift that from the morris.js examples, but you must assign the chart to a variable:
var donut = new Morris.Donut({...});
Finally the code to add hover events should look like this:
for(i = 0; i < donut.segments.length; i++) {
  donut.segments[i].handlers['hover'].push(function(i){
    $('#morrisdetails-item .morris-hover-row-label').text(donut.data[i].label);
    $('#morrisdetails-item .morris-hover-point').text(donut.data[i].value);
  });
}
Here is a working example on JSFiddle.
Great, thx!